Impacts of urban road charging have been looked at for a higher proportion of schemes than for other types of scheme. This is maybe because road tolling is often a more controversial measure. The results for a number of cities are given below.


Impacts of the following cities can be found below.
London
Milan
Stockholm
Gothenburg
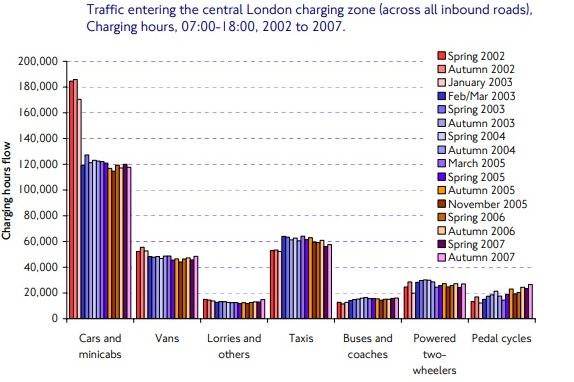
The London road tolling scheme has been very effective. Before the introduction of the Central London Congestion Charge there was significant traffic congestion in central London. Over half of the time spent by vehicles in central London during the daytime, the vehicles were either stopped in traffic or travelling less than 10km/h. This is about the same speed as in the days of horse and cart!
Those that needed to drive in the area to deliver goods had difficulty to access the area, and required longer or more vehicles and drivers than they do now. This congestion was very expensive for those needing to drive in the central London.
For example the impacts of the Central London Congestion Scheme include:
- Congestion reduced by 30%, and the volume of traffic reduced by 15%.
- The proportion of time that drivers spend stationary or moving slowly in queues reduced by up to one-third. This means that journey times are not only shorter, but also more reliable and more predictable – particularly for buses.
- Traffic entering the zone was reduced by 18%, traffic circulating the zone was reduced by 15%.
- Bus usage was increased by 38%, with 23% more public transport provided, due to there being more space on the roads.
- Surveys of Londoners ‘on-street’ suggest that beneficial effects on environmental quality are being recognised
- The reduction in traffic and its smoother operation reduced traffic emissions of nitrogen oxides (NOx) and Particulate Matter (PM10) by 12% in the zone. The impact on the ring road were less than plus/minus 2%
- CO2 emissions were reduced by 19%, fuel by 20%
- Traffic on the ring road surrounding the charging area (where traffic is not charged) showed small reductions in congestion, reflecting better operational management, despite slightly higher traffic flows caused by the charging scheme.
- No significant negative impact was identified on business and economy.
The impact can be seen graphically below.
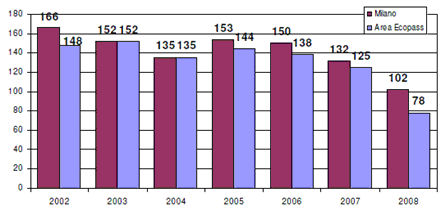
The impacts of the Area C have been
- Reduction of incoming traffic of just over 30%
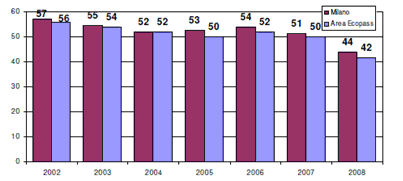
- During hours of Area C operation, the increase of commercial speed of public transport in the area is 5.7% for buses and 4.7% for trams.
- No evidence the of deterioration in the speed of public transport outside the area
- Impact on air quality emissions:
- PM10 exhaust -19%;
- PM10 total -18%;
- NH3, Ammonia -31%;
- NOx Nitrogen oxides -10%;
- CO2 Carbon dioxide -22%
- Inside Area C compared to external area the following results:
- Concentrations of Black Carbon (BC) from -28% to -43%;
- Content of BC in PM10 (ratio BC/PM10) from -16% to -46%;
- Content of BC in PM2.5 (ratio BC/PM2.5) from -22% to -46%.
- Inside Area C compared to external area the following results:
- Concentrations of Black Carbon (BC) from -28% to -43%;
- Content of BC in PM10 (ratio BC/PM10) from -16% to -46%;
- Content of BC in PM2.5 (ratio BC/PM2.5) from -22% to -46%.
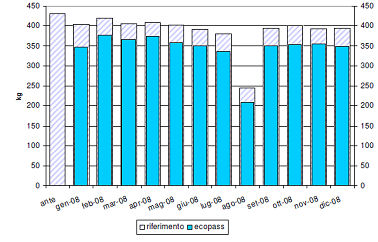
The Area C traffic data from 2015 can be seen in this graph published by the Milan City Authority. The months of the year are shown on the bottom legend, traffic on the left hand side. Click on the graph for a larger version.
The Area C, designed to reduce traffic, has achieved its goal, leading to a reduction of 41000 entries per day into the Area C area and has also allowed the City Administration to reinvest into sustainable mobility. Over €13 million, net of the costs of running the service (running costs €7,100,000), was allocated to the expansion of subways, trams and buses and the implementation of the second phase of bike sharing in Milan (BikeMi).
€10 million has been used to improve public transport. 15 surface lines could be supercharged throughout the city, including trams and buses. Journeys were increased to more than 250 journeys per day, and the frequency of all subways (to 32 per day), extended during rush hour (extended to 10 a.m. instead of 9am). Moreover, an additional €3 million were used for BikeMi, and there are were 3300 bikes in circulation in 2012.
In addition, between 2012 and 2015: almost €4 million was used for interchange parking in Comasina, €3 million for 30 kph zones and up to €20 million to build and redevelop cycle lanes and cycle paths.
From its start to 2012 the Area C has raised over €20,300,000. Of the payments, 48% were paid for by paper permits and pay and display machines, 30.4% by Telepass, 12.5% by Pin enabled on www.areac.it, to 8.5% from activations of Rid (possible until September 2012) and 0.6% by ATMs.

Estimates are that emissions of CO2 from motor vehicles in the inner city fell by between 14% and 18% as a result of the congestion charge/tax.
Gothenburg (half a million inhabitants in Sweden) introduced a congestion charge in 2013, and has reduced traffic by around 12% during the week daytime, when the charge is in place.
Diagram: Weekday traffic volume (6 a.m. to 6:30 p.m.) in the Gothenburg charging zone before and after congestion pricing. (Transportation Research Part A)
Commuters also found their travel times reduced:

Diagram: Travel time reduction since congestion implementation during weekday morning rush hours in Gothenburg. (Transportation Research Part A)
Find further information on Gothenburg's traffic reduction the citylab website, or from the scientific paper)