

Euro standards are the main way of classifying vehicle emissions. Without the right emissions standard, you can not enter over 200 European cities in 12 countries. Find out where by country or city.
There are a number of different ways to identify a vehicles emissions standard:
National Euro standard websites
Vehicle registration papers
Vehicle engine / door frame
Other ways of identifying emissions standard
Incentives for lower emitting vehicles
What do I do if my diesel vehicle does not meet the standard?
Vehicle Euro standards
National Euro standard websites
If your vehicle is registered in the countries below, you can check your emissions standard online (see the links)
- Austria,
- Belgium,
- Denmark,
- France,
- Italy,
- Netherlands,
- Norway
- Spain
- If your UK vehicle meets the current London LEZ emissions standards.
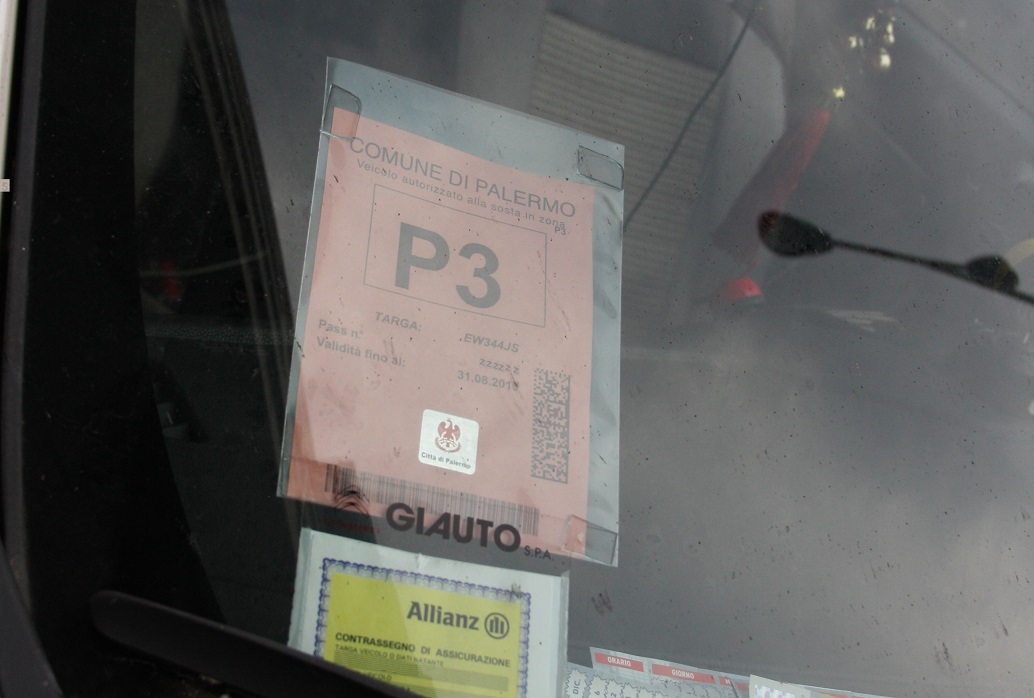
Vehicle registration papers
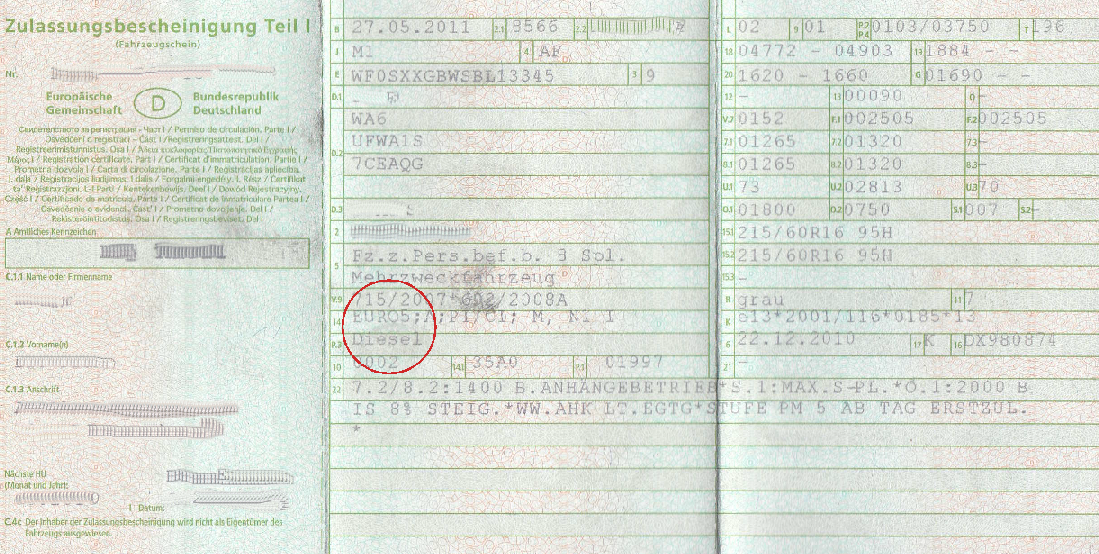
In many countries this information is on the vehicle registration papers. See below for an example from Germany. The Euro standard is circled in red.
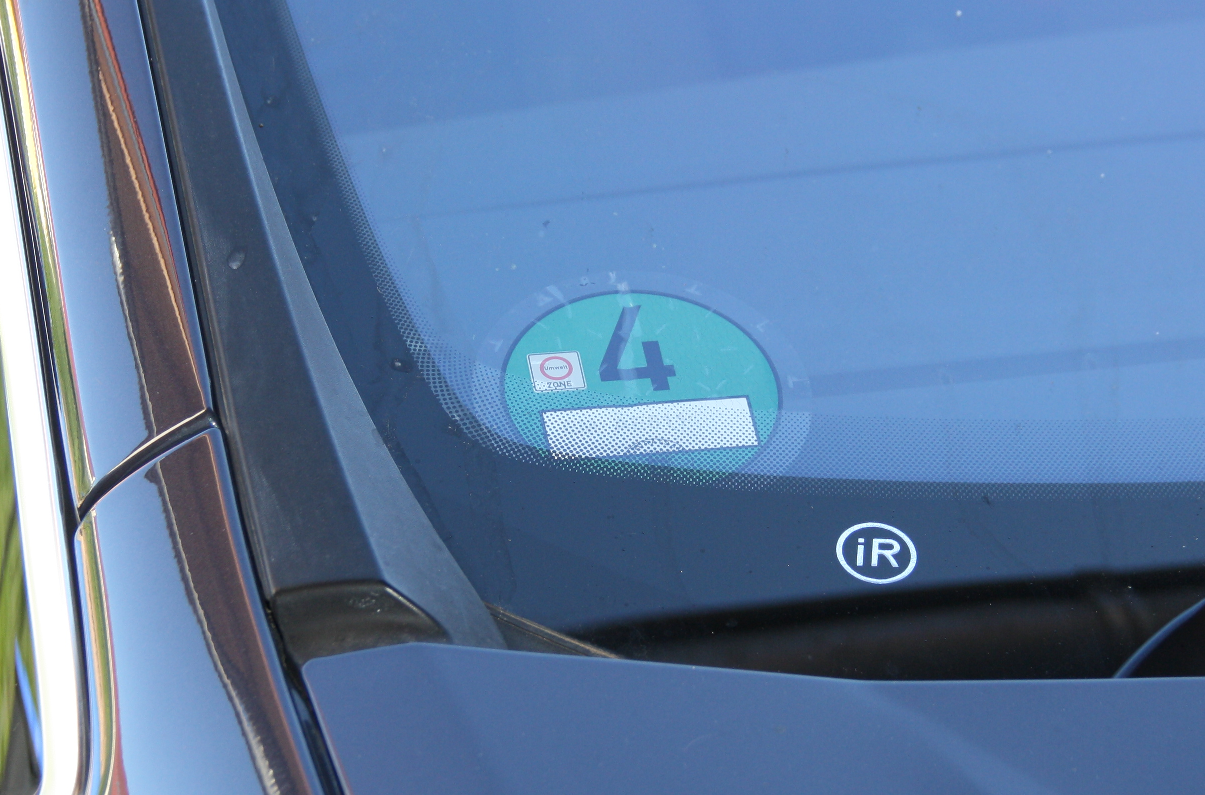
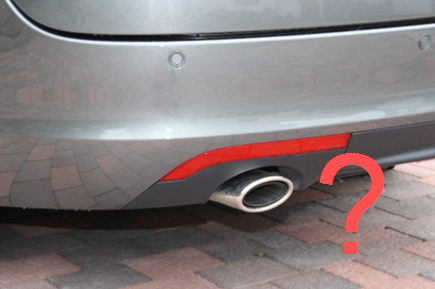
Car Door Frame
It can also often be found on the car door frame. See the photo below.
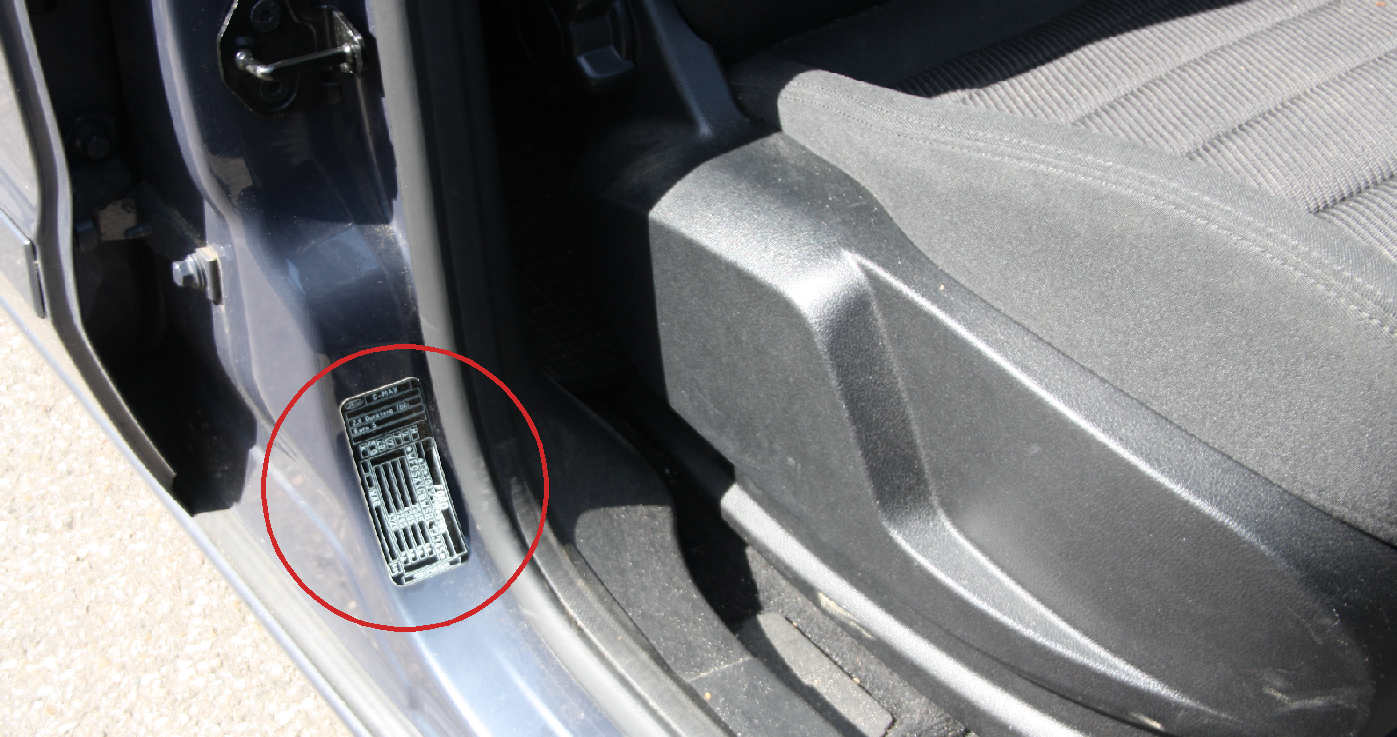
For lorries, coaches and buses, the engine and frame are often made separately.
Other ways to find out what your vehicle Euro standard include:
- For newer vehicles, the Euro emission standard may be listed on the registration documents. In the UK this is in the V5C (V5C registration certificate, or log book in section D.2).
- On some vehicles the Euro standard is on the inside of the (passenger or driver) door frame (when you open the door, look on all the surfaces of the door frame).
- Your local dealer or manufacturer should be able to provide the information. It is useful to provide the dealer or manufacturer with as much information as possible about the vehicle, including the chassis number and engine number.
- For lorries and coaches, where the body and engine are often manufactured separately, the vehicle engine details are very important when contacting the manufacturer for the Euro standard.
Otherwise, the vehicle age and type will tell you the Euro standard for most petrol or diesel fuelled vehicles. See the section below on emission standards.
Most countries also give other incentives for lower emitting vehicles
This can be for example cheaper
- road tax
- motorway tolls,
- congestion charging,
- parking to cleaner vehicles, or electric vehicles.
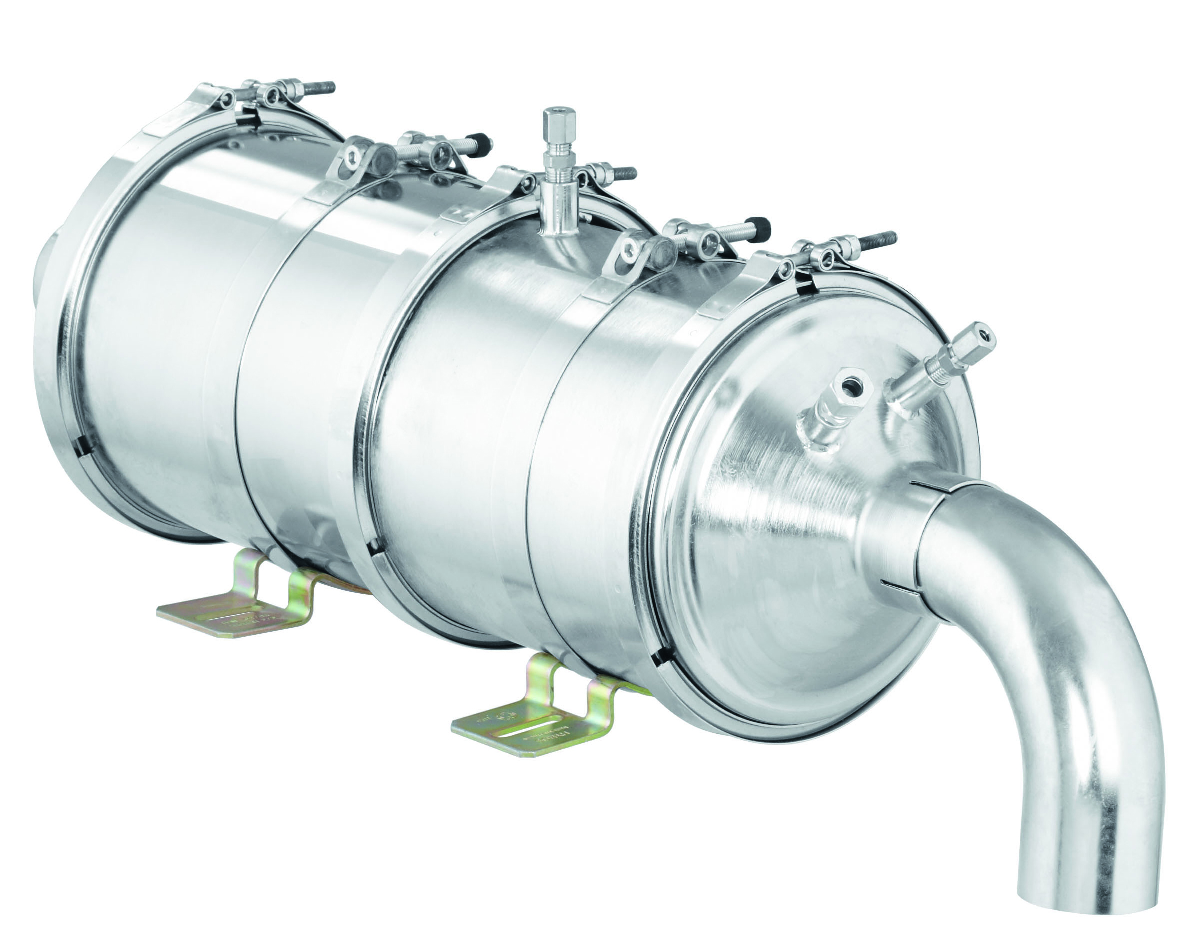
What to do if your diesel vehicle does not meet the standards?
If your diesel vehicle does not meet the standards, you may be able to fit your vehicle with a diesel particulate filter. The particulate filter reduces emissions from the vehicle. After fitting a particulate filter a many low emission zones allow you in the zone.

© puritech, © Gregory Gerber - shutterstock.com
Vehicle Euro Standards
The 'Euro' emissions standards are developed by the European Commission. They have greatly helped to reduce pollution. Many cities use these Euro standards to keep the older, more polluting, vehicles out of the cities. These are often called low emission zones. Find out where the low emission zones in Europe are though our city search, or with our map).
Every 4 to 5 years a new Euro standard has ensured that the vehicles sold have lower emissions. The timings of these standards by vehicle type are given in the table below. This gives a guide to what emissions standard each type of vehicle will be, depending on when it was manufactured, as a guide only.
All dates listed in the tables refer to new type approvals (i.e. new vehicle models). Around one year is the date when vehicles are no longer allowed to be first registered if the do not meet the standards.
Emissions standard dates for new vehicle models
|
|
Euro 1 |
Euro 2 |
Euro 3 |
Euro 4 |
Euro 5 |
Euro 6 |
Euro 6d temp | Euro 6d | Euro 7 |
|
Passenger cars |
July 92 |
Jan 96 |
Jan 00 |
Jan 05 |
Sept 209 |
Sept 14 |
Sept 17 | Sept 20 | Nov 26 |
|
Light commercial vehicles (N1-I) ≤1305kg |
Oct 94 |
Jan 98 |
Jan 00 |
Jan 05 |
Sept 10 |
Sept 14 |
Sept 17 | Sept 20 | Nov 26 |
|
Light commercial vehicles (all others) |
Oct 94 |
Jan 98 |
Jan 01 |
Jan 06 |
Sept 10 |
Sept 15 |
Sept 17 | Sept 21 | Nov 26 |
|
Lorries and buses |
1992 |
1995 |
1999 |
2005 |
2008 |
2013 |
Sept 18 | May 28 | |
|
Motorcycles |
2000 |
2004 |
2007 |
2016 |
2020 |
|
|||
|
Mopeds |
2000 |
2002 |
|
2017 |
2020 |
|
The dates above give an approximate guide to Euro standards of vehicles.
- The dates given above are when all new vehicle models have to meet the standards. Around one year is the date when vehicles are no longer allowed to be first registered if the do not meet the standards (Except lorries and buses Euro 6d which is 3 years later, Euro 6dtemp 2 years).
- Some vehicle models were released before the dates below, so met standards earlier than they were legally required to.
- Other vehicles may have a newer engine than the vehicle was manufactured with.
- A few small production models were given extensions, so will met the standards later.
- There are other phases of Euro 6/VI, eg Euro 6a, Euro 6e, Euro VI-E which have different testing conditions, but so far these have not been used in LEZs with the exception of Euro 6d-Temp
Your vehicle papers, or the links above, may give more accurate information. In some countries the more accurate data is not available for all vehicle types, and an estimation is made using the dates below, or sometimes other data from the vehicle manufacturers.
RDE is 'Real world Driving Emissions', which is a test brought in to ensure that vehicle emissions are reduced in the real world, not just in the test lab. The vehicle will be driven outside and on a real road according to random acceleration and deceleration patterns. New vehicle models must meet it from September 2017, and it will be tightened in September 2019.
The emission standards for an EEV are between Euro 5 and 6.
This page on the European Commission website gives more information on the Euro standards. Dieselnet also gives information on world-wide diesel and petrol vehicle emissions standards.