Existing vehicles can be fitted with devices to reduce their emissions, often called retrofitting. 'Diesel particulate filters can be fitted to reduce particle emissions and selective catalytic reduction for NOx emissions.
These are possible to be used to meet the emissions standards in some countries, see here.
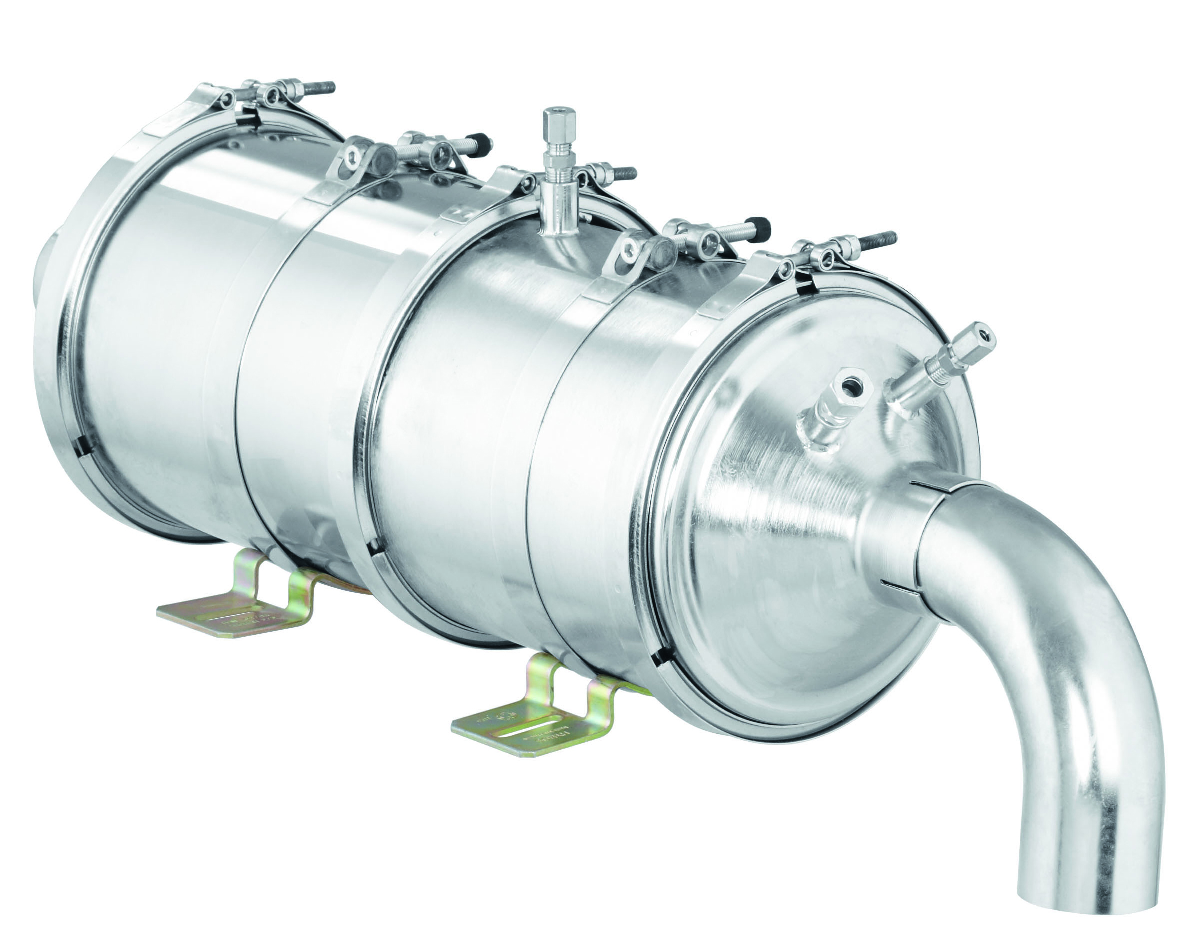
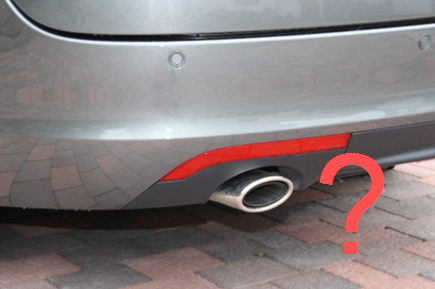
Picture © puritech
Diesel particulate filter (DPF) and Selective Catalytic Reduction (SCR)
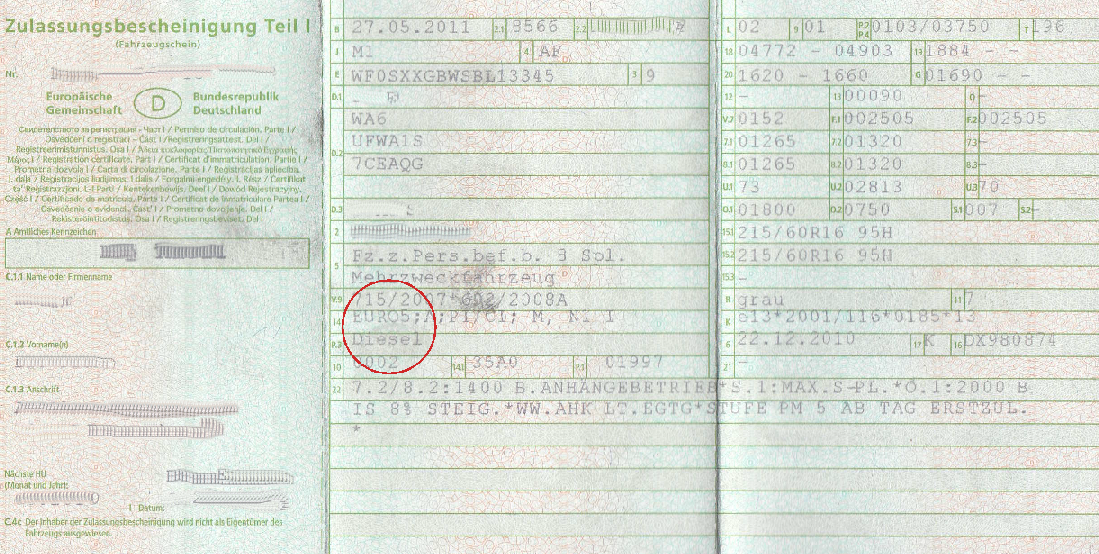
Many low emission zones have a emissions standard set, for example the particulate aspect of Euro 3. This can allow existing vehicles to fit diesel particulate filter (or 'retrofitt') to reduce the particulate emissions to meet the emissions standards.
Certified retrofit devices should be used, to make sure that they work properly. Each country that allows retrofitting for the low emission zones has filters that are certified; make sure the filter you fit is certified in the country you are based, or want to travel. The manufacturers and garages will know which ones are certified.
- A ‘full’ DPF, which will reduce particulate emissions between 85% and 99%. They are also very effective at reducing emissions of the very smallest particulates which are of greatest concern to health. They are usually only available for new vehicles from the factory or to retrofit heavy duty vehicles.
- A ‘partial’ filter, which reduces emissions between around 30% and 50%. They tend not to reduce emissions of the smallest particles as effectively as for the larger particles, but are available to retrofit light duty vehicles.
If you decide to fit a filter, it is important to get one that is correctly chosen both for your vehicle and vehicle usage, and is certified for the LEZ(s) you wish to travel in.
The company or agency providing or fitting your filter should be able to advise you for the right equipment for your vehicle and vehicle usage. For the environmental and health impact, a full particulate filter is a much better option - and will also give access to more LEZs for longer.
In some countries there are also financial incentives to support the retrofitting of particulate filters.
Selective Catalytic Reduction (SCR)
This is technology that can be fitted to existing vehicles to reduce emissions of oxides of nitrogen (NOx) by up to 70%.
SCR is fitted together with a DPF and is becoming more common and is being used extensively in London to improve bus emissions. Both SCR and DPFs are required to be retrofitted to enable older heavy duty vehicles to go into the LEZs in Sweden.