What are urban road tolls?

An urban road toll is where entry to an area is subject to payment. This is usually done to reduce traffic congestion or traffic jams in the city, but can also improve other issues, such as air quality and noise. In most cities the money raised from the schemes is usually spent improving transport in and around the city.

Information sign on Area C and Telepass London Congestion Charging Road Sign Milano Area C sign Telepass      


 What are urban road tolls?

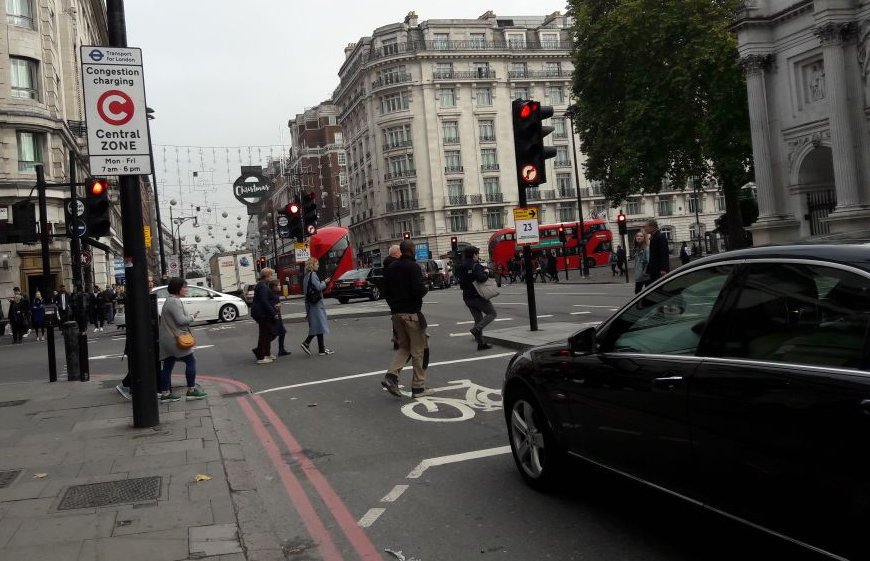
The most well known schemes are in London and Stockholm, but there are other schemes in Europe. 

The urban road toll can be operated by camera enforcement, an electronic transponder, or by paying on entry to the area.

Other cities do not allow dirtier vehicles to go into the city (low emission zones) or require permits or other regulations (Access Regulations).

Some access regulations require payment for permits - if you are permitted to have a permit. However, these schemes are covered under Access Regulations.

Why Urban Road Tolls?

Many cities and towns struggle with the balance of congestion, air pollution, noise levels, accessibility, damage to historic buildings and other pressures of urban life. Many cities have levels of pollution that harm our health, and much of the pollution comes from the traffic. Congested, polluted, noisy cities are not attractive for businesses or residents. Congestion also has a significant impact on the economy, costing nearly 100 billion Euro, or 1% of the EU's GDP, annuallyi. Urban Road Tolls, or Congestion Charging is one of the ways to reduce traffic and congestion in a city, and ensure that those that need to travel with a vehicle - for example deliveries - can travel rather than sitting in a traffic jam.
There are many ways to seek to tackle these issues, usually with a combination of many measures together, see what else is being done to reduce air pollution?.  A number of cities have a tolling scheme, to regulate access to the whole or parts of the city.

How to find schemes on our website

To find the Urban road tolling schemes search our map for the red dots (you can un-click the other schemes to make it easier), or look under the scheme lists in the country pages to find the schemes, or in the case of Italy the regional pages.
Cities with charging schemes are noted with a "- CS" after the city name, and the name appears in red. Where the menu item has just the city name, the scheme is a low emission zone, - AR and blue is an access regulation.


Impacts of urban road charging have been looked at for a higher proportion of schemes than for other types of scheme. This is maybe because road tolling is often a more controversial measure. The results for a number of cities are given below.


Impact of Milan's Area C from the start to 2015 
Impact London Congestion Charge 
Impact Gothenburg city road toll congestion tax

Impacts of the following cities can be found below.

London  
Milan   
Stockholm
Gothenburg

London

The London road tolling scheme has been very effective. Before the introduction of the Central London Congestion Charge there was significant traffic congestion in central London. Over half of the time spent by vehicles in central London during the daytime, the vehicles were either stopped in traffic or travelling less than 10km/h. This is about the same speed as in the days of horse and cart!

Those that needed to drive in the area to deliver goods had difficulty to access the area, and required longer or more vehicles and drivers than they do now. This congestion was very expensive for those needing to drive in the central London.

For example the impacts of the Central London Congestion Scheme include:

  • Congestion reduced by 30%, and the volume of traffic reduced by 15%.
  • The proportion of time that drivers spend stationary or moving slowly in queues reduced by up to one-third. This means that journey times are not only shorter, but also more reliable and more predictable – particularly for buses.
  • Traffic entering the zone was reduced by 18%, traffic circulating the zone was reduced by 15%.
  • Bus usage was increased by 38%, with 23% more public transport provided, due to there being more space on the roads.
  • Surveys of Londoners ‘on-street’ suggest that beneficial effects on environmental quality are being recognised
  • The reduction in traffic and its smoother operation reduced traffic emissions of nitrogen oxides (NOx) and Particulate Matter (PM10) by 12% in the zone. The impact on the ring road were less than plus/minus 2%
  • CO2 emissions were reduced by 19%, fuel by 20%
  • Traffic on the ring road surrounding the charging area (where traffic is not charged) showed small reductions in congestion, reflecting better operational management, despite slightly higher traffic flows caused by the charging scheme.
  • No significant negative impact was identified on business and economy.

The impact can be seen graphically below.

Impact London Congestion Charge


Milan

Milan has had three variations of its low emission zone. One is the regional LEZ (Milano Province), and the other two are the combined LEZ and Congestion Charge, first called Ecopass and then Area C.
With the Ecopass vehicles payed according to their emissions, together with the regional LEZ that did not allow the more polluted vehicles to access during the winter. The Area C charges a flat rate for vehicles, but does not allow diesel vehicles to go into the city with a lower Euro standard than Euro 3, or petrol Euro 0.
 

The impacts of the Area C have been

  • Reduction of incoming  traffic of just over 30%
  • During hours of Area C operation, the increase of commercial speed of public transport in the area is 5.7%  for buses and 4.7%  for trams.
  • No evidence the of deterioration in the speed of public  transport  outside the area
  • Impact on air quality emissions:
    • PM10 exhaust                   -19%;
    • PM10  total                        -18%;
    • NH3, Ammonia                    -31%;
    • NOx Nitrogen oxides         -10%;
    • CO2 Carbon dioxide           -22%
  • Inside Area C compared to external area the following results:
    • Concentrations of Black Carbon (BC) from -28% to -43%;
    • Content of BC in PM10 (ratio BC/PM10) from -16% to -46%;
    • Content of BC in PM2.5 (ratio BC/PM2.5) from -22% to -46%.
  • Inside Area C compared to external area the following results:
    • Concentrations of Black Carbon (BC) from -28% to -43%;
    • Content of BC in PM10 (ratio BC/PM10) from -16% to -46%;
    • Content of BC in PM2.5 (ratio BC/PM2.5) from -22% to -46%.


The Area C traffic data from 2015 can be seen in this graph published by the Milan City Authority. The months of the year are shown on the bottom legend, traffic on the left hand side. Click on the graph for a larger version.

Impact of Milan's Area C from the start to 2015

The Area C, designed to reduce traffic, has achieved its goal, leading to a reduction of 41000 entries per day into the Area C area and has also allowed the City Administration to reinvest into sustainable mobility. Over €13 million, net of the costs of running the service (running costs €7,100,000), was allocated to the expansion of subways, trams and buses and the implementation of the second phase of bike sharing in Milan (BikeMi).

€10 million has been used to improve public transport. 15 surface lines could be supercharged throughout the city, including trams and buses. Journeys were increased to more than 250 journeys per day, and the frequency of all subways (to 32 per day), extended during rush hour (extended to 10 a.m. instead of 9am). Moreover, an additional €3 million were used for BikeMi, and there are were 3300 bikes in circulation in 2012.

In addition, between 2012 and 2015: almost €4 million was used for interchange parking in Comasina, €3 million for 30 kph zones and up to €20 million to build and redevelop cycle lanes and cycle paths.

From its start to 2012 the Area C has raised over €20,300,000. Of the payments, 48% were paid for by paper permits and pay and display machines, 30.4% by Telepass, 12.5% by Pin enabled on www.areac.it, to 8.5% from activations of Rid (possible until September 2012) and 0.6% by ATMs.

The previous Ecopass improved air quality concentrations by:
– PM10 annual average 4%, exceedences 13%
• The Ecopass reduced emissions from traffic (as well as traffic flow)
– PM10 19%, NOx 11%, CO2 9%
 
• During Area C operation 7:30-19:30 traffic emissions reduced by
– PM10 18%, NOx 10%, CO2 22%
 
Because the Milan schemes are also a congestion charge, they also reduce the number of vehicles travelling into the city, unlike most other LEZs, which do not change the number of vehicles entering the zone. This means that they also reduce emissions of CO2, which the other LEZs generally do not.
 
Before the Ecopass, the 35th day of the year was also the 35th day of PM10 exceedence in Milan. After the Ecopass this was pushed that back to the end of February - see the graph below.
Graph with the improvements from the Milan Ecopass on PM10 exceedences
The impact on number of days exceeding the PM10 Limit Value of 50μg/m3 in the Ecopass area can be seen in the graph below (blue with Ecopass, red/purple without Ecopass).
Impact of Milan Ecopass on EU PM10 Limit Values
 
The impact on PM10 annual average concentrations in the air of the Ecopoass area can be seen in the graph below (blue with Ecopass, red/purple without Ecopass).
Impact of Milan Ecopass on annual average PM10
The impact on the annual emissions of nitrogen oxides (NOx) can be seen in the graph below (blue with Ecopass, grey without Ecopass).
Impact of Milan Ecopass on NOx emissions
 
Stockholm Congestion Charge
 
Stockholm first introduced a trial congestion charge, which was determined to be successful. Following the trial the city had a referendum on whether the congestion charge should become permanent. The referendum chose for a congestion charge.
 
The impact of the permanent congestion charge in Stockholm was found to be:
In 2008 the reduction of traffic across the tax cordon was 18%, compared to 2005, before the introduction of the congestion charge, or its trial.
The charge has led to a rapid increase in the number of exempted alternative fuel vehicles in the Stockholm areas. The proportion of trips made by alternative fuel vehicles has increased from 3% during the trial to 13% in 2008.

Estimates are that emissions of CO2 from motor vehicles in the inner city fell by between 14% and 18% as a result of the congestion charge/tax.


Gothenburg

Gothenburg (half a million inhabitants in Sweden) introduced a congestion charge in 2013, and has reduced traffic by around 12% during the week daytime, when the charge is in place.

Impact Gothenburg city road toll congestion tax

Diagram: Weekday traffic volume (6 a.m. to 6:30 p.m.) in the Gothenburg charging zone before and after congestion pricing. (Transportation Research Part A)

Commuters also found their travel times reduced:

Gothenburg city congestion charge commuter travel times reduced

Diagram: Travel time reduction since congestion implementation during weekday morning rush hours in Gothenburg. (Transportation Research Part A)

Find further information on Gothenburg's traffic reduction the citylab website, or from the scientific paper)

What do I need to do before I enter an urban toll area?

Do I need to register for charging schemes? No, you usually do not have to, but it is often cheaper if you do.

Registering by internet Registering by phone Registering by Mobile phone


In which road toll cities do I have to do what?

In some schemes you have to pay after entering or crossing. For other schemes you receive a bill by post.

The table below sets out the options.

Type of payment

Type of payment/registration

Bill by post if not registered (but cheaper if you register)

All Norwegian schemes

Bill by post if not registered Goteborg, Stockholm and Valetta (Malta),

Either
1) pay when or shortly after you enter or cross, or
2) register for easier payment

Milan Area C, Dartford

London (easier and cheaper)

Pay at entry gates

Durham

For details on how to pay see each city (linked above).

Find Scheme in Bolzano Province By Map

To the right of this text is a map of all schemes. Below this text is a map of all schemes. Click for a larger map. All Bolzano (also known as Bozen or Südtirol) Province cities with schemes are listed below by scheme main type. Scroll to find all cities. Click to find full information on schemes for that page.

Find Scheme in Bozen (Südtirol) PROVINCE by List

Other Access Regulations

Urban Road Tolls

No Schemes

Pollution Emergency

No Scheme


Milan
Paris
Brussels
Amsterdam
SUBSCRIBE TO OUR NEWSLETTER
Subscribe to newsletter